



Echocardiography in Cardiac Amyloidosis: Red Flags, Strain Imaging and Apical Sparing
Echocardiography in cardiac amyloidosis plays a central role in early disease recognition. It provides information about ventricular wall thickness, chamber size, atrial enlargement, valvular and septal abnormalities, diastolic function, right ventricular involvement and myocardial deformation. In addition, clinicians commonly use echocardiography as a frontline imaging test when they first suspect an infiltrative cardiomyopathy (1, 2).
However, no single echocardiographic feature is diagnostic of cardiac amyloidosis. Instead, clinicians should look for a combination of structural, hemodynamic and deformation-based abnormalities. When several red flags occur together, the probability of an infiltrative process rises substantially (2, 3).
Importantly, echocardiography can raise suspicion for cardiac amyloidosis but cannot reliably distinguish transthyretin cardiac amyloidosis (ATTR-CM) from immunoglobulin light-chain cardiac amyloidosis (AL). Therefore, a strongly suggestive echocardiographic pattern should trigger the appropriate downstream diagnostic pathway rather than serve as the final etiologic diagnosis (1).
Key principle: Echocardiography does not diagnose amyloid type. Its major role is to recognize a pattern that should prompt further evaluation for cardiac amyloidosis.
Echocardiography in Cardiac Amyloidosis: Key Structural Red Flags
Amyloid deposition progressively alters cardiac structure and function. Standard two-dimensional echocardiography may therefore reveal a characteristic cluster of abnormalities, although individual findings are not specific enough to confirm the diagnosis on their own.
Common structural red flags include:
- Increased left ventricular wall thickness
- Right ventricular wall thickening
- Biatrial enlargement
- Thickening of the interatrial septum and atrioventricular valves
- Small or normal left ventricular cavity with reduced stroke volume
- Small pericardial or pleural effusions
- Increased myocardial echogenicity, historically described as a granular or sparkling appearance
These abnormalities reflect the infiltrative and restrictive nature of the disease. For example, ventricular wall thickening results from myocardial amyloid deposition rather than conventional cardiomyocyte hypertrophy. Moreover, progressive ventricular stiffness raises filling pressures and contributes to atrial enlargement (1, 4).
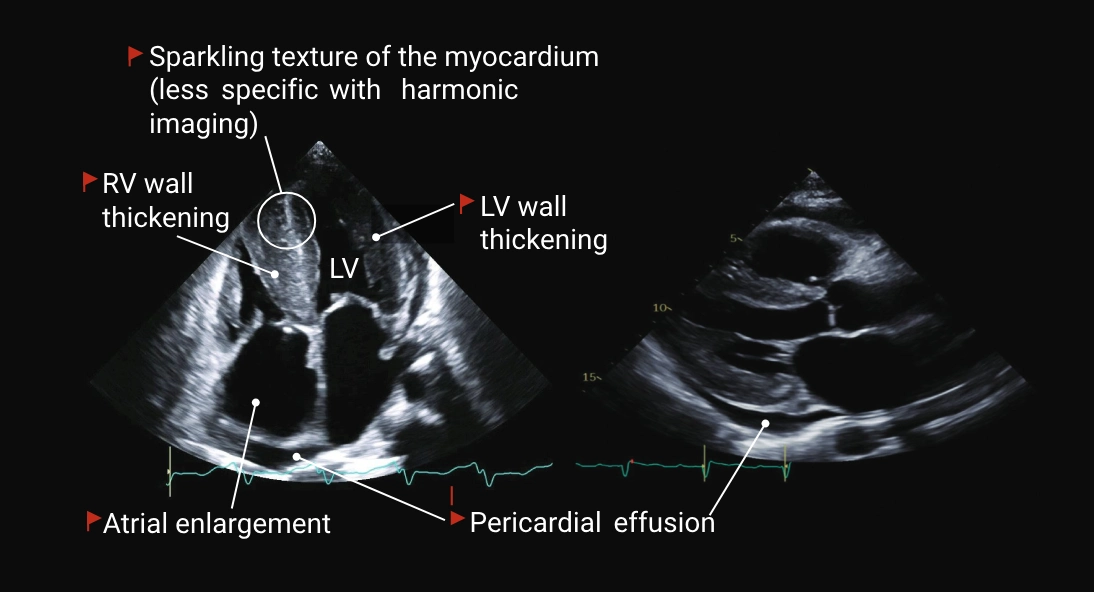
Figure 1. Conventional echocardiographic red flags in cardiac amyloidosis. Typical findings may include increased left and right ventricular wall thickness, biatrial enlargement, small pericardial effusion and increased myocardial echogenicity. The historically described “sparkling” appearance of the myocardium is not sufficiently specific to establish the diagnosis.
The classic description of a “granular sparkling” myocardium should be interpreted cautiously. Modern harmonic imaging has reduced the specificity of this appearance, and increased myocardial echogenicity can occur in other conditions. Therefore, clinicians should not use this sign in isolation (5).
Increased Ventricular Wall Thickness: A Red Flag, Not a Diagnosis
One of the most recognizable echocardiographic findings in cardiac amyloidosis is increased left ventricular wall thickness. However, this appearance should not automatically be interpreted as conventional left ventricular hypertrophy. In cardiac amyloidosis, extracellular amyloid infiltration contributes substantially to the apparent increase in myocardial thickness (1).
An unexplained LV wall thickness of approximately 12 mm or greater should therefore raise suspicion for cardiac amyloidosis, particularly when it occurs together with other structural, Doppler or strain abnormalities (1).
Importantly, cardiac amyloidosis does not always produce a perfectly symmetric pattern. Patients with ATTR-CM may demonstrate concentric thickening, but asymmetric septal patterns can also occur and may mimic hypertrophic cardiomyopathy (4).
Wall Thickness and ECG Voltage Discordance
A particularly useful clue is the apparent mismatch between increased ventricular wall thickness on echocardiography and unexpectedly low QRS voltage on the ECG. This discordance can increase suspicion for an infiltrative cardiomyopathy because the electrical signal may appear disproportionately small relative to the myocardial thickness seen on imaging (1).
Nevertheless, low ECG voltage is not present in every patient with cardiac amyloidosis. Therefore, its absence should not be used to exclude the diagnosis.
Diastolic Dysfunction on Echocardiography in Cardiac Amyloidosis
Amyloid infiltration progressively reduces myocardial compliance. As a result, abnormalities of diastolic function are central to the echocardiographic phenotype of cardiac amyloidosis.
Doppler echocardiography may demonstrate:
- Grade 2 or worse diastolic dysfunction
- Increased E/A ratio
- Shortened E-wave deceleration time
- Elevated E/e′ ratio, suggesting increased LV filling pressure
- Reduced mitral annular tissue Doppler velocities
- A progressively restrictive filling pattern as disease advances
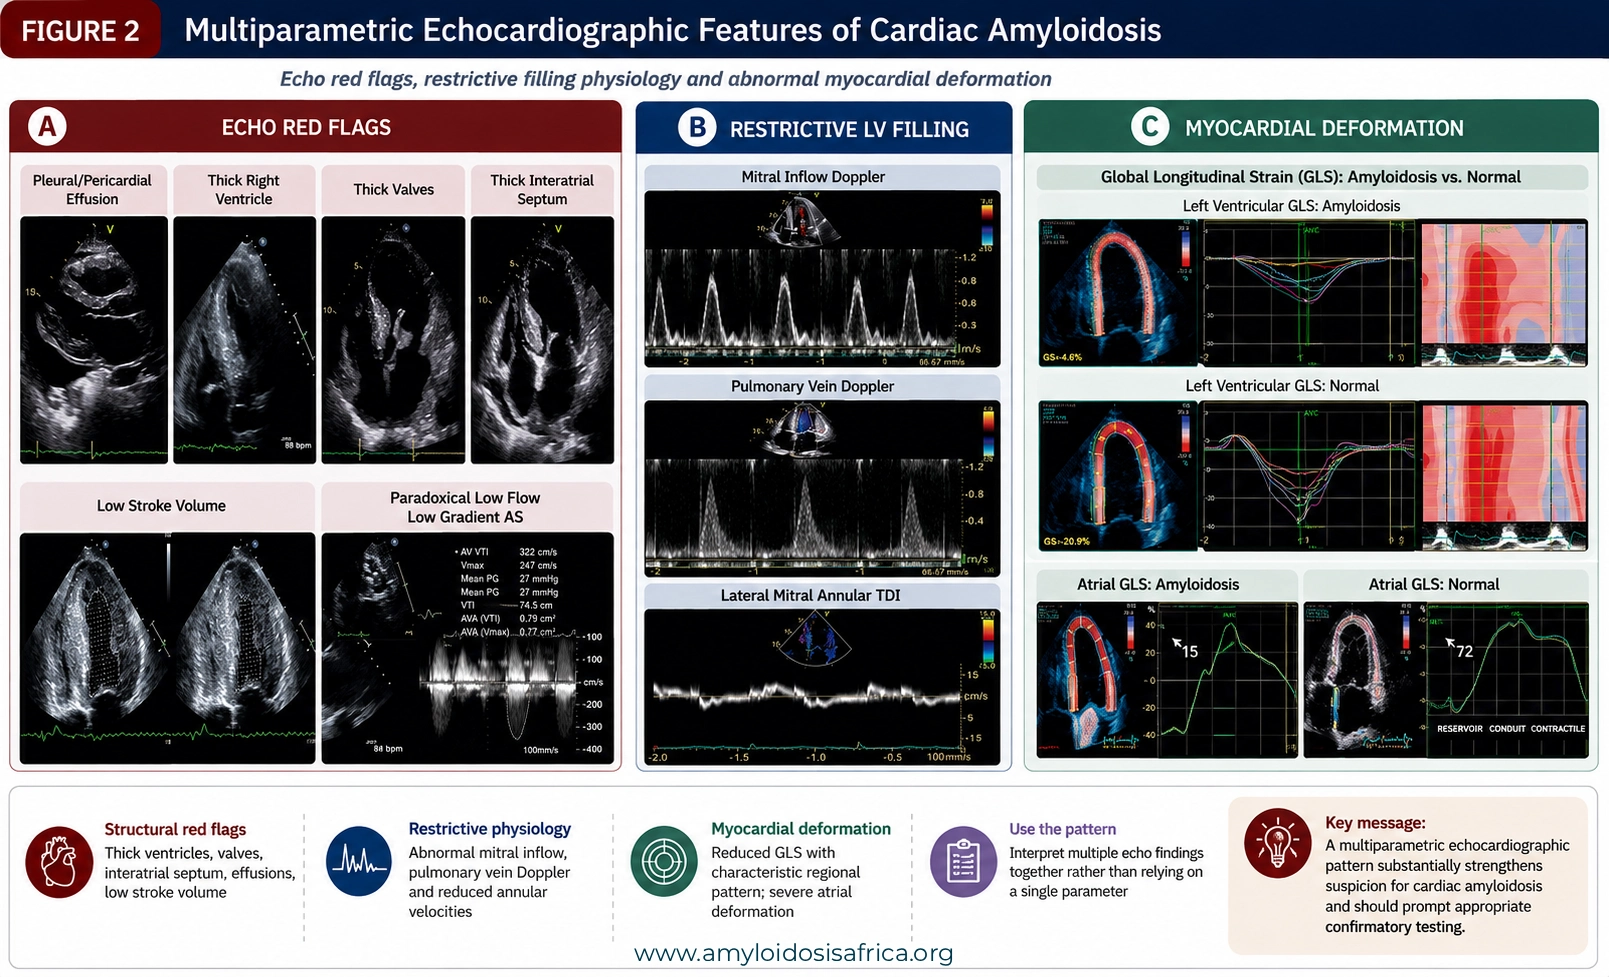
Figure 2. Echocardiographic red flags in cardiac amyloidosis. Structural findings include ventricular wall thickening, valve and interatrial septal thickening, pericardial or pleural effusion, reduced stroke volume and paradoxical low-flow, low-gradient aortic stenosis. Doppler findings may demonstrate restrictive filling physiology, while strain imaging can reveal impaired longitudinal deformation with relative apical sparing.
In more advanced disease, mitral inflow may show a high E-wave velocity, a relatively small A wave and a shortened deceleration time. These findings reflect rapid early filling into a stiff, noncompliant ventricle followed by rapid equilibration of left atrial and left ventricular diastolic pressures (1).
In the standardized framework used in the reference material, an E/A ratio greater than 1.5 and E-wave deceleration time below 150 ms are among findings that may support significant diastolic dysfunction (1).
However, diastolic abnormalities evolve with disease stage. Therefore, a patient with early cardiac amyloidosis may not yet display a classic restrictive filling pattern.
Tissue Doppler Imaging and the “5-5-5” Sign
Tissue Doppler imaging provides additional information about longitudinal myocardial function. In cardiac amyloidosis, systolic and diastolic annular velocities progressively decline as myocardial infiltration and dysfunction advance (1).
A classic tissue Doppler pattern is the “5-5-5” sign, in which all three major mitral annular velocities are reduced:
s′ < 5 cm/s — reduced systolic longitudinal velocity
e′ < 5 cm/s — reduced early diastolic relaxation velocity
a′ < 5 cm/s — reduced late diastolic atrial contraction velocity
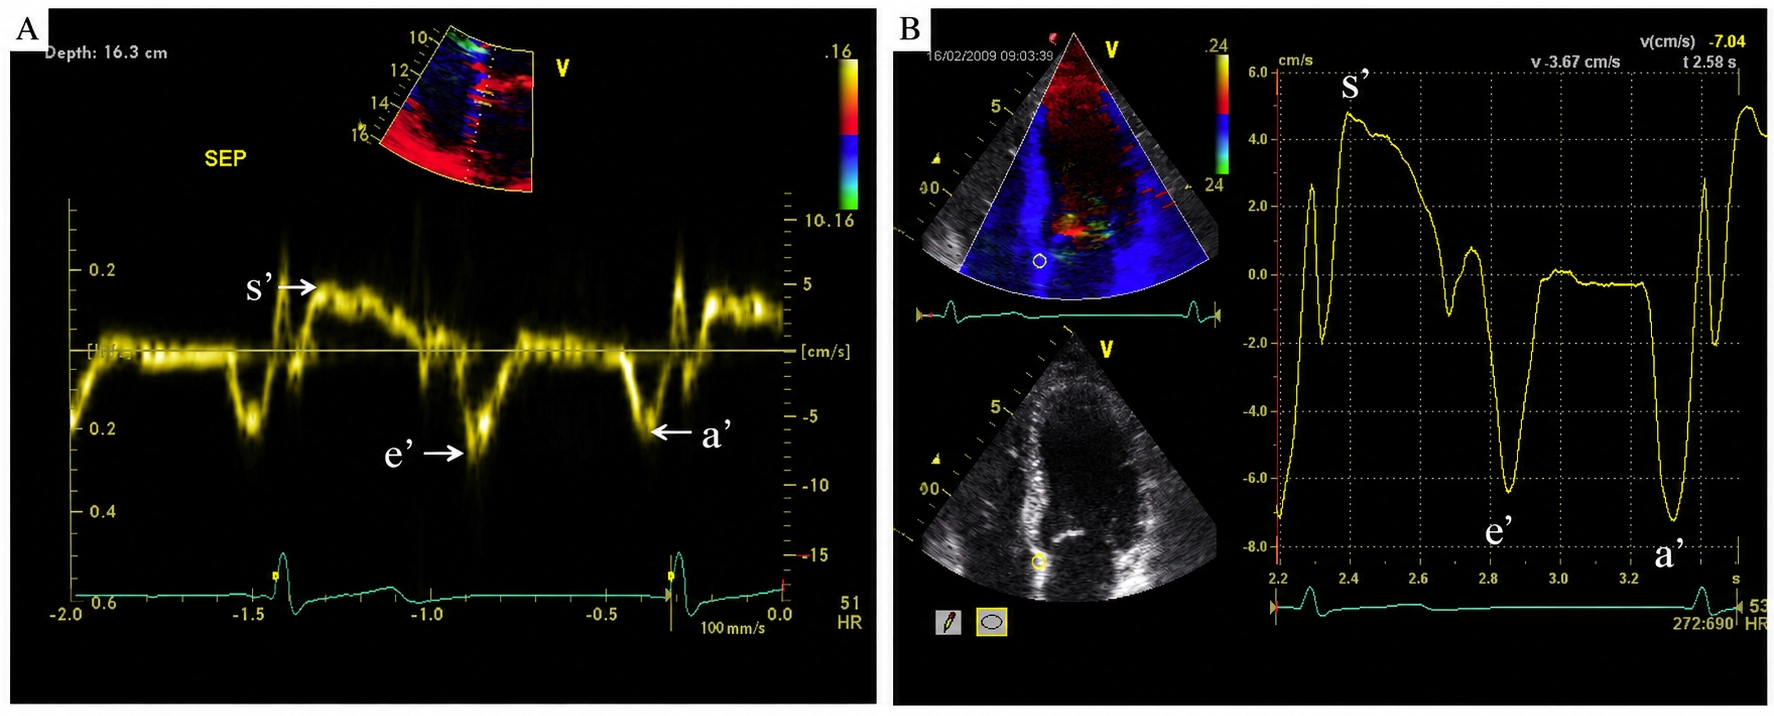
Figure 2. Tissue Doppler imaging in cardiac amyloidosis. Pulsed-wave tissue Doppler imaging of the mitral annulus demonstrates reduced systolic (S′), early diastolic (e′), and late diastolic (a′) velocities. Reduction of all three velocities to <5 cm/s has been described as the “5-5-5 sign,” an echocardiographic finding associated with advanced cardiac amyloid infiltration.
Reference:
Fontana M, Pica S, Reant P, et al. Echocardiographic features of cardiac amyloidosis: a comprehensive review. Heart Lung Circ. 2015;24(2):e26–e27. Heart, Lung and Circulation – source figure
When present, this pattern can be highly suggestive of cardiac amyloidosis. However, it is more commonly seen in advanced disease and may lack sensitivity in earlier stages (1).
Why Echocardiography in Cardiac Amyloidosis Requires a Multiparametric Approach
The diagnostic value of echocardiography improves when clinicians interpret findings as a cluster rather than relying on a single abnormality. Structural changes, restrictive physiology, reduced tissue Doppler velocities and myocardial deformation abnormalities provide complementary information (1, 2).
Global Longitudinal Strain in Cardiac Amyloidosis
Left ventricular ejection fraction can remain preserved despite substantial impairment of longitudinal myocardial function. Therefore, speckle-tracking echocardiography can reveal abnormalities that conventional ejection fraction may underestimate.
In cardiac amyloidosis, global longitudinal strain is typically reduced, with basal and mid-ventricular segments often more severely affected than the apex (3, 6).
A decreased absolute GLS value below approximately 15% is considered abnormal in the reference framework. However, the regional distribution of strain may be even more informative than the global value alone (1).
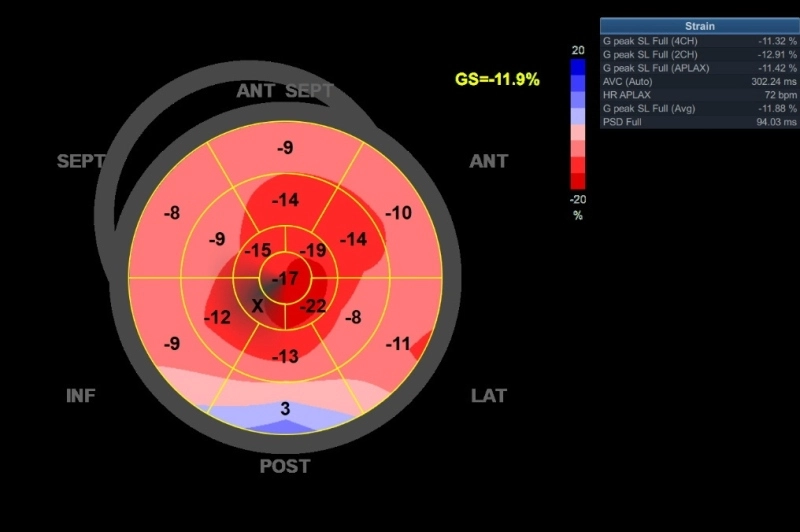
Figure 3. Relative apical sparing pattern on longitudinal strain imaging in cardiac amyloidosis. Left ventricular global longitudinal strain (GLS) bull’s-eye map demonstrating relatively preserved apical longitudinal strain compared with more impaired basal and mid-ventricular segments. This characteristic pattern is commonly described as relative apical sparing or the “cherry-on-top” pattern and can raise suspicion for cardiac amyloidosis in the appropriate clinical context.
Source:
StatPearls. Left Ventricular Global Longitudinal Strain Assessment. Figure: GLS “cherry-on-top” pattern. NCBI Bookshelf – source figure
Apical Sparing on Echocardiography in Cardiac Amyloidosis
One of the best-known echocardiographic features of cardiac amyloidosis is relative apical sparing of longitudinal strain.
In this pattern, longitudinal strain is markedly reduced in basal and mid-LV segments, while apical strain remains relatively preserved. On a polar or bullseye map, this distribution creates the characteristic “cherry-on-the-top” appearance (6).
Although relative apical sparing can substantially strengthen suspicion, clinicians should not regard it as a standalone diagnostic test. Instead, they should interpret the pattern within the broader structural, Doppler and clinical assessment.
How Is Relative Apical Sparing Quantified?
Visual recognition of the bullseye pattern is useful, but clinicians can also quantify relative apical sparing.
Relative apical sparing index
Average apical longitudinal strain
÷
(Average basal strain + average mid-ventricular strain)
A relative apical sparing ratio greater than 1 has been described as supportive of cardiac amyloidosis. Other strain-based ratios, including apical-to-basal relationships, can also contribute to multiparametric diagnostic assessment (6, 7).
Atrial Strain in Cardiac Amyloidosis
Cardiac amyloidosis is not exclusively a ventricular disease. Amyloid infiltration and chronically elevated filling pressures can cause both structural and functional atrial abnormalities.
Biatrial enlargement is common. However, atrial dysfunction may be much greater than chamber size alone suggests.
Speckle-tracking echocardiography may reveal severely impaired left atrial reservoir strain, with disruption of normal reservoir, conduit and contractile function. These abnormalities reflect both atrial involvement and the hemodynamic consequences of restrictive ventricular physiology (2).
Valvular and Right-Heart Echocardiographic Red Flags
Amyloid infiltration can extend beyond the left ventricular myocardium. Therefore, careful assessment of the valves, right ventricle and interatrial septum can provide additional diagnostic clues.
Potential findings include:
- Thickened mitral and tricuspid valve leaflets
- Restricted leaflet motion
- Mitral or tricuspid regurgitation
- Thickened interatrial septum
- Right ventricular wall thickening
- Reduced right ventricular systolic function
These features are not diagnostic by themselves, but they add weight to the overall echocardiographic pattern when they occur together with unexplained LV wall thickening, restrictive physiology and abnormal longitudinal strain (8).
Cardiac Amyloidosis and Low-Flow, Low-Gradient Aortic Stenosis
Paradoxical low-flow, low-gradient aortic stenosis is another phenotype that may coexist with cardiac amyloidosis, particularly ATTR-CM.
The combination of a small ventricular cavity, thickened walls, restrictive physiology and reduced stroke volume can contribute to a low-flow state. Therefore, clinicians should consider cardiac amyloidosis when wall thickening and low-flow physiology appear disproportionate to the expected effects of conventional hypertensive remodeling or isolated valvular disease.
Multiparametric Echocardiographic Scoring
Because no individual echocardiographic parameter provides perfect diagnostic accuracy, investigators have developed multiparametric scoring systems that combine structural, hemodynamic and strain findings.
One proposed increased-wall-thickness score incorporates:
- Relative LV wall thickness
- E/e′ ratio
- TAPSE
- Global longitudinal strain
- Apical-to-basal longitudinal strain ratio
The purpose of these scores is not to replace definitive testing. Rather, they can help identify patients with increased wall thickness who warrant further evaluation for cardiac amyloidosis (7).
Echocardiography in Cardiac Amyloidosis in Resource-Limited Settings
In settings where cardiac magnetic resonance, nuclear scintigraphy or amyloid typing are not immediately available, echocardiography can play an especially important role in identifying patients who need further investigation or referral.
Even when speckle-tracking imaging is unavailable, conventional measurements such as wall thickness, chamber size, Doppler filling patterns, tissue Doppler velocities, stroke volume and right ventricular function can help clinicians recognize a suspicious phenotype.
Therefore, a standardized echocardiographic approach may help shorten diagnostic delays by identifying patients who should proceed to monoclonal protein testing, bone-avid tracer scintigraphy, specialist referral or other confirmatory investigations.
Echocardiography Raises Suspicion, but It Does Not Type the Amyloid
A strongly suggestive echocardiographic phenotype is not the end of the diagnostic pathway.
Importantly, echocardiography cannot reliably distinguish ATTR from AL cardiac amyloidosis. Therefore, clinicians need further evaluation before making disease-specific treatment decisions (1, 9).
Exclude AL Amyloidosis
When cardiac amyloidosis is suspected, clinicians should evaluate for a monoclonal plasma-cell disorder using:
- Serum free light chains
- Serum immunofixation
- Urine immunofixation
Evaluate for ATTR-CM
When the monoclonal protein evaluation does not indicate AL amyloidosis, bone-avid tracer scintigraphy with 99mTc-PYP, DPD or HMDP may form part of the diagnostic pathway for ATTR-CM (1).
Clinical takeaway: A characteristic echocardiogram should trigger amyloidosis testing. It should not be used to label a patient as ATTR or AL without the appropriate confirmatory pathway.
A Practical Echocardiography Checklist for Cardiac Amyloidosis
When reviewing an echocardiogram in a patient with unexplained heart failure or increased ventricular wall thickness, ask:
- Is LV wall thickness increased without a sufficient explanation?
- Is the right ventricular wall also thickened?
- Are both atria enlarged?
- Are the valves or interatrial septum thickened?
- Is the LV cavity small with reduced stroke volume?
- Is there a small pericardial or pleural effusion?
- Is there significant diastolic dysfunction?
- Are tissue Doppler velocities markedly reduced?
- Is GLS reduced?
- Is there relative apical sparing?
- Is atrial strain severely impaired?
The more of these findings that occur together, the stronger the echocardiographic suspicion for cardiac amyloidosis.
Key Takeaways
- Echocardiography in cardiac amyloidosis is a frontline tool for recognizing a suspicious phenotype.
- No single echocardiographic feature is diagnostic.
- Important structural clues include increased LV and RV wall thickness, biatrial enlargement, thickened valves and interatrial septum, a small LV cavity and small effusions.
- Restrictive physiology and reduced tissue Doppler velocities become more prominent as disease advances.
- The “5-5-5” tissue Doppler sign can be highly suggestive but may be absent in earlier disease.
- GLS can reveal impaired longitudinal function despite preserved ejection fraction.
- Relative apical sparing produces the classic “cherry-on-the-top” strain pattern.
- Atrial strain may reveal severe atrial mechanical dysfunction.
- Multiparametric interpretation is more useful than relying on any single echocardiographic parameter.
- Echocardiography cannot reliably distinguish ATTR from AL amyloidosis.
- Strongly suggestive findings should prompt monoclonal protein assessment and appropriate confirmatory testing.
Recognize the Echocardiographic Pattern
The greatest value of echocardiography in cardiac amyloidosis lies in pattern recognition.
Unexplained ventricular wall thickening, a small ventricular cavity, biatrial enlargement, restrictive physiology, reduced tissue Doppler velocities, impaired longitudinal strain and relative apical sparing should collectively raise suspicion for an infiltrative cardiomyopathy.
The purpose of the echocardiogram is not to make the final amyloid diagnosis. It is to recognize the disease early enough to start the correct diagnostic pathway.
Recognize the pattern. Raise the suspicion. Confirm the diagnosis. Type the amyloid.
References
- Dorbala S, Ando Y, Bokhari S, Dispenzieri A, Falk RH, Ferrari VA, et al. ASNC/AHA/ASE/EANM/HFSA/ISA/SCMR/SNMMI Expert Consensus Recommendations for Multimodality Imaging in Cardiac Amyloidosis: Part 1 of 2—Evidence Base and Standardized Methods of Imaging. Circ Cardiovasc Imaging. 2021;14(4):e000029. doi:10.1161/HCI.0000000000000029.
- Dorbala S, Cuddy S, Falk RH. How to image cardiac amyloidosis: a practical approach. JACC Cardiovasc Imaging. 2020;13(6):1368–1383. doi:10.1016/j.jcmg.2019.07.015.
- Ternacle J, Bodez D, Guellich A, Audureau E, Rappeneau S, Lim P, et al. Causes and consequences of longitudinal LV dysfunction assessed by 2D strain echocardiography in cardiac amyloidosis. JACC Cardiovasc Imaging. 2016;9(2):126–138. doi:10.1016/j.jcmg.2015.06.019.
- Gonzalez-Lopez E, Gagliardi C, Dominguez F, Quarta CC, de Haro-Del Moral FJ, Milandri A, et al. Clinical characteristics of wild-type transthyretin cardiac amyloidosis: disproving myths. Eur Heart J. 2017;38(24):1895–1904. doi:10.1093/eurheartj/ehx043.
- Falk RH, Quarta CC. Echocardiography in cardiac amyloidosis. Heart Fail Rev. 2015;20(2):125–131. doi:10.1007/s10741-014-9451-7.
- Phelan D, Collier P, Thavendiranathan P, Popovic ZB, Hanna M, Plana JC, et al. Relative apical sparing of longitudinal strain using two-dimensional speckle-tracking echocardiography is both sensitive and specific for the diagnosis of cardiac amyloidosis. Heart. 2012;98(19):1442–1448. doi:10.1136/heartjnl-2012-302353.
- Boldrini M, Cappelli F, Chacko L, Restrepo-Cordoba MA, Lopez-Sainz A, Giannoni A, et al. Multiparametric echocardiography scores for the diagnosis of cardiac amyloidosis. JACC Cardiovasc Imaging. 2020;13(4):909–920. doi:10.1016/j.jcmg.2019.10.011.
- Chacko L, Karia N, Venneri L, Bandera F, Dal Passo B, Buonamici L, et al. Progression of echocardiographic parameters and prognosis in transthyretin cardiac amyloidosis. Eur J Heart Fail. 2022;24(9):1700–1712. doi:10.1002/ejhf.2606.
- Garcia-Pavia P, Rapezzi C, Adler Y, Arad M, Basso C, Brucato A, et al. Diagnosis and treatment of cardiac amyloidosis: a position statement of the ESC Working Group on Myocardial and Pericardial Diseases. Eur Heart J. 2021;42(16):1554–1568. doi:10.1093/eurheartj/ehab072.
Medical Disclaimer
This article provides educational and informational content only and does not replace individualized medical advice, diagnosis or treatment. Echocardiographic findings should be interpreted within the full clinical context and alongside appropriate laboratory, nuclear imaging, genetic, pathology or other investigations when indicated.

Leave a Reply